Analysis News

  • The best newsletter in the market
  • Customisable and personal
  • By e-mail every morning, for free

Receive Analysis News:

EMail:

Free daily newsletter every morning

Content
Signals
All indicators - Medium term
OMX Stockholm Real EstMay 3, 2024
Skanska BMay 3, 2024
CloettaMay 3, 2024
Lindab InternationalMay 3, 2024
Medicover BMay 3, 2024

The market showed a small gain Friday, and OMX Stockholm PI ended the day at 955 points, which is an increase of 0.8 percent. For the week as a whole the index showed only a slight change of +0.3 percent.

563 shares showed a gain and 385 showed a loss. 83 shares were unchanged and closed at the same price as the previous day. There was no trading in 52 shares.

Total value of the trading volume for shares and primary capital certificates Friday was approximately 106.2 billion.

Karnov Group closed at 86.00 kronor after a huge gain of 30.9 percent. The stock has never gained more in one day since we started measuring this May 10. 2019. It was also extremely high volume. Overall it was traded for 391 millions kronor in the stock, which is 70 times as much as normal daily turnover. Technically it also looks good. The stock is trend wise positive in the medium term, has support at 62.00 kronor and a further increase is indicated.
Essity B closed at 275 kronor after a small loss of 0.3 percent. The stock thereby reversed down after 11 days of gains. Nor does it look good technically. The stock is trend wise negative in the medium term and a further decline is indicated.
Hexatronic Group ended with a solid gain of 18.6 percent and closed at 38.65 kronor. The previous time the stock gained this much was Feb 9, when it closed up 34.2 percent. It was also high volume. Overall it was traded for 220 millions kronor in the stock, which is four times as much as normal daily turnover. It also looks good technically. The stock is trend wise negative in the medium term, but has broken up through resistance at 36.00 kronor.
Skanska B moved up and ended at 197 kronor, which is an increase of 1.3 percent. We must go back to Apr 2022 to find a higher close for the stock. This past week the stock has gained as much as 5.8 percent. Technically it also looks good. The stock is trend wise positive in the medium term, has support at 176 kronor and a further increase is indicated.
Lindab International closed down 2.7 percent to 210 kronor. The stock has not closed at a lower price since Mar 5. The stock broke down through the support at 211 kronor in head and shoulders formation. This triggered a sell signal on increasing volume and a further drop to 189 kronor within three months is indicated. It was also high volume. Overall it was traded for 123 millions kronor in the stock, which is four times as much as normal daily turnover.

US 500 rises on Friday
The market moved up Friday, and S&P 500 ended at 5128 points, which is an increase of 1.3 percent. The week as a whole showed a gain of 0.5 percent.

Indices
OMX Stockholm PI
arrow green   Positive Candidate
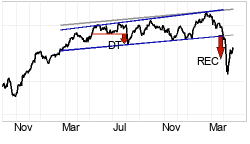
OMX Stockholm PI has broken through the floor of a rising trend channel in the medium long term. This indicates a slower rising rate at first, or the start of a more horizontal development. The price has risen strongly since the positive signal from the rectangle formation at the break through resistance at 828. The objective at 914 is now met, but the formation still gives a signal in the same direction. There is no resistance in the price chart and further rise is indicated. In case of a negative reaction, the index has support at approximately 860 points. The index is overall assessed as technically positive for the medium long term.
S&P 500
arrow green   Positive Candidate
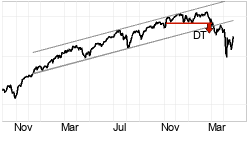
S&P 500 has broken through the floor of a rising trend channel in the medium long term. This indicates a slower rising rate at first, or the start of a more horizontal development. The index has broken a resistance level in the short term and given a positive signal for the short-term trading range. The index is between support at points 4970 and resistance at points 5250. A definitive break through of one of these levels predicts the new direction. The index is overall assessed as technically positive for the medium long term.
Today's candidate
Ascelia Pharma (ACE) Price 11.76, May 3, 2024
chart
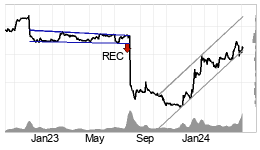
Investors have paid higher prices over time to buy Ascelia Pharma and the stock is in a rising trend channel in the medium long term. Rising trends indicate that the company experiences positive development and that buy interest among investors is increasing. The stock is approacing resistance at 13.80 kronor, which may give a negative reaction. However, a break upwards through 13.80 kronor will be a positive signal. Volume has previously been high at price tops and low at price bottoms. This strengthens the trend. The stock is overall assessed as technically positive for the medium long term.
Recommendation: Positive
Latest days indices
AEX0.99%887.44
CAC400.54%7957.57
COMPX1.99%16156.00
DAX0.59%18002
HEX0.60%9966.99
N1000.52%1504.89
OMXC25GI0.36%2185.56
OMXSPI0.76%954.50
OSEBX0.50%1371.30
PSI20-0.25%6648.67
TECDAX0.81%3266.22
BUK100P0.46%819.94
EURUSD0.53%1.0800
CL (OIL)-1.06%78.11
Indices Evaluations
 SML
AEXpospospos
CAC40pospospos
COMPXneutralpospos
DAXpospospos
HEXposposneutral
N100posneutralpos
OMXC25GIpospospos
OMXSPIpospospos
OSEBXpospospos
PSI20pospospos
TECDAXnegneutralneutral
BUK100Ppospospos
EURUSDnegpospos
CL (OIL)negneutralneutral

S: Short term.    M: Medium term.    L: Long term.
Stock Exchange barometer
Stockholmsbörsen - Medium term
 
      
33% 47% 20%
 370 Buy Candidates
 532 Neutral
 222 Sell Candidates
Track what the insiders are doing! Insider buys in green, insider sales in red.
 
   Last month:
   81% Positive
   361 Positive
   87 Negative
Disclaimer Copyright © 2024 Investtech.com AS, Org nr 978 655 424 MVA


Investtech guarantees neither the entirety nor accuracy of the analyses. Any consequent exposure related to the advice / signals which emerge in the analyses is completely and entirely at the investors own expense and risk. Investtech is not responsible for any loss, either directly or indirectly, which arises as a result of the use of Investtechs analyses. Details of any arising conflicts of interest will always appear in the investment recommendations. Further information about Investtechs analyses can be found here disclaimer. The content provided by Investtech.com is NOT SEC or FSA regulated and is therefore not intended for US or UK consumers.

Cancel Analysis News
[ Back to default newsletter setup ]

Edit AnalysisNews

Register as a recipient of AnalysisNews in order to customise the content.


Investtech guarantees neither the entirety nor accuracy of the analyses. Any consequent exposure related to the advice / signals which emerge in the analyses is completely and entirely at the investors own expense and risk. Investtech is not responsible for any loss, either directly or indirectly, which arises as a result of the use of Investtechs analyses. Details of any arising conflicts of interest will always appear in the investment recommendations. Further information about Investtechs analyses can be found here disclaimer. The content provided by Investtech.com is NOT SEC or FSA regulated and is therefore not intended for US or UK consumers.


Investtech guarantees neither the entirety nor accuracy of the analyses. Any consequent exposure related to the advice / signals which emerge in the analyses is completely and entirely at the investors own expense and risk. Investtech is not responsible for any loss, either directly or indirectly, which arises as a result of the use of Investtechs analyses. Details of any arising conflicts of interest will always appear in the investment recommendations. Further information about Investtechs analyses can be found here disclaimer. The content provided by Investtech.com is NOT SEC or FSA regulated and is therefore not intended for US or UK consumers.

Titlex

OK
+

Cookie consent

We use cookies to give you a better user experience. If you continue to use the website, you accept this. For further details click here.

Our use of cookies

When you use our website, we store a cookie on your device. The cookie is used to recognize your device so that your settings work when you use our websites. The information that is stored is completely anonymised. Cookies are automatically deleted after a certain time.

Necessary cookies

Investtech uses cookies to ensure basic functions such as page navigation and language selection. Without such cookies, the website does not function as it should. You cannot therefore make a reservation against these. If you still want to disable such cookies you can do so in your browser settings. In the Cookies section add this website to the list of sites which are not allowed to save cookies on your device.

Cookies from Google

We use services from Google Analytics and Google AdWords. These register cookies on your device when you visit our website. Google registers your IP address in order to keep statistics on user activity on the website. The IP address is anonymised, so that we have no opportunity to link the activities to a specific person. We use these statistics to be able to offer more interesting content on the website and to constantly improve ourselves. Google AdWords collects data so that our advertising on other websites gives better results. We cannot trace the data of individuals.

Allow cookies from Google