
 Oslo Børs
 Stockholmsbörsen
 Københavns Fondsbørs
Investeringsforeninger
Københavns Fondsbørs
Investeringsforeninger
 Helsingin pörssi
 World Indices
 US Stocks
US 30
Nasdaq 100
US 500
US Stocks
US 30
Nasdaq 100
US 500
 Toronto Stock Exchange
 London Stock Exchange
 Euronext Amsterdam
 Euronext Brussel
 DAX
SDAX
TECDAX
Frankfurt
CDAX
MDAX
Prime Standard
DAX
SDAX
TECDAX
Frankfurt
CDAX
MDAX
Prime Standard
 CAC 40
 Mumbai S.E.
National S.E.
Mumbai S.E.
National S.E.
 Commodities
 Currency
 Cryptocurrency
 Exchange Traded Funds
 Investtech Indices
3 solid positives and 1 to stay away from, what to wait for!
Published November 9, 2018
Webinar November 14
Join our free online webinar on November 14 . Analyst Kiran Shroff and Country Manager Jan Marius van Leeuwen will give an introduction to Investtech's analyses and present stock picking tools & strategies.
Nifty 50 index has behaved positively in the last few sessions and closed very close to its resistance level of 10600. If it manages to close above it and sustain, it may challenge the 10800 level. On the downside there is support between 10400 and 10000 points. Lets see if this year's Diwali special session has set the market tone already or not.
We have found four possible opportunities for you that may prove to be good bets in the short to medium term.
Century Textiles & Ind (CENTURYTEX.NS) Close: 867.10
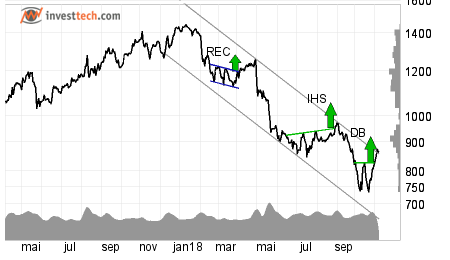 Century Textiles & Industries Limited has broken through the ceiling of a falling trend channel in the medium term. After falling by almost 50 per cent from its top in January, the stock has pulled itself up and established a double bottom formation along with the breakout from the resistance at 850 rupees. Further rise to 920 or more is indicated.
Volume balance and the momentum indicator have been in favour of this recent price rise, which is a positive sign. On the downside there is support between 850 and 830 rupees.
Investtech's outlook (one to six months): Positive
Marico Limited (MARICO.NS)) Close: 339.65
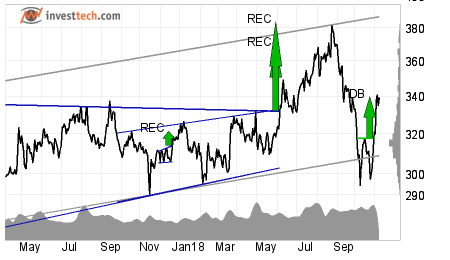 Marico Limited shows strong development within a rising trend channel in the medium term. Rising trends indicate that the company experiences positive development and that buy interest among investors is increasing. The stock has support at rupee 332 and resistance at rupee 382.
Positive volume balance shows that volume is higher on days with rising prices than days with falling prices. This indicates increasing optimism among investors. The stock is overall assessed as technically positive for the medium term.
Investtech's outlook (one to six months): Positive
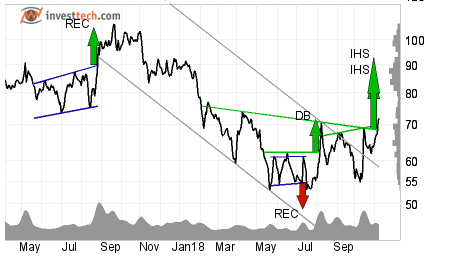
Trident Limited (TRIDENT.NS) Close: 71.85
 This one looks really interesting.
After almost being sliced to half, Trident Limited stock prices have had a great comeback. The stock broke out through the ceiling of the downward trend channel and have given a breakout from two inverted head and shoulders formations. The stock is just below its short term resistance at 74 rupees. If it breaks through resistance and closes above this level, the stock may rise up to the 92.50 levels or more. There is support between 67 and 62 rupees.
The volume balance indicator is very positive, indicating buyers at every level of the price rise. RSI is also above 70, which suggests good price increase in the past weeks.
Only due to the nearness of the resistance level, our recommendation in the stock is weak positive instead of a clear positive in Trident limited.
Investtech's outlook (one to six months): Weak Positive
Hexaware Technologies (HEXAWARE.NS) Close: 312.40
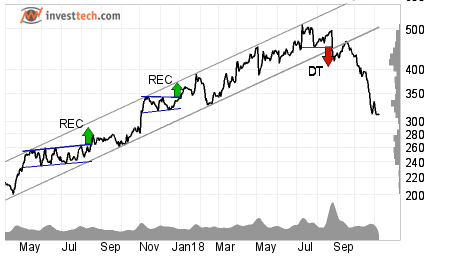 There has been a fall of over 25 per cent in Hexaware Technologies since the price broke down from the uptrend channel and the double top formation in the medium term chart.
The stock has broken multiple support levels and is now trading below its support at 330 rupees. Next support is not seen before 260 rupees in the medium term graph. In case of a reaction up, there is resistance around 330 and then at 390 rupees respectively.
RSI below 30 shows that the momentum of the stock is strongly negative in the short term. Investor have steadily reduced the price to sell the stock, which indicates increasing pessimism and continued falling prices.
Investtech's outlook (one to six months): Negative
The analyses are based on closing price as per November 7, 2018. Maintaining proper stop loss is always recommended.
Written by

Analyst - Investtech
Archive:
06 November: Banking stocks look positive
02 November: Positive on this one
01 November: TECHM, NIFTY50 and Hausse
31 October: What are investors thinking?
30 October: Bullish on these three stocks
26 October: Three potential candidates to ride on
24 October: Three big Metal stocks, Seasonal variation
22 October: Among top performers on our Top 50 list
18 October: Three stocks investors should stay away from
17 October: Flowing against the tide
16 October: Positive on these 2 stocks
11 October: Over 45 per cent rise
9 October: The Indian banking space
5 October: Nifty closes at a crucial level
2 October: Price formations in the long-term charts
28 September: Positive on Biocon Limited
"Investtech analyses the psychology of the market and gives concrete trading suggestions every day."

Partner & Senior Advisor - Investtech

Investtech guarantees neither the entirety nor accuracy of the analyses. Any consequent exposure related to the advice / signals which emerge in the analyses is completely and entirely at the investors own expense and risk. Investtech is not responsible for any loss, either directly or indirectly, which arises as a result of the use of Investtechs analyses. Details of any arising conflicts of interest will always appear in the investment recommendations. Further information about Investtechs analyses can be found here disclaimer.
The content provided by Investtech.com is NOT SEC or FSA regulated and is therefore not intended for US or UK consumers.
Head office
Strandveien 171366 Lysaker, Norway
Research department
Instituttveien 102007 Kjeller, Norway