Oslo Børs
 Stockholmsbörsen
 Københavns Fondsbørs
Investeringsforeninger
Københavns Fondsbørs
Investeringsforeninger
 Helsingin pörssi
 World Indices
 US Stocks
US 30
Nasdaq 100
US 500
US Stocks
US 30
Nasdaq 100
US 500
 Toronto Stock Exchange
 London Stock Exchange
 Euronext Amsterdam
 Euronext Brussel
 DAX
SDAX
TECDAX
Frankfurt
CDAX
MDAX
Prime Standard
DAX
SDAX
TECDAX
Frankfurt
CDAX
MDAX
Prime Standard
 CAC 40
 Mumbai S.E.
National S.E.
Mumbai S.E.
National S.E.
 Commodities
 Currency
 Cryptocurrency
 Exchange Traded Funds
 Investtech Indices
DNB Bank (DNB.OL)
Close: 196.65 (+2.35), May 3, 2024
Complete report
Algorithmic Overall Analysis
Positive (Score: 80)
May 3, 2024. Updated daily.
Analyst's Recommendation
Positive
May 3, 2024. 1 days ago.
Analyses

Short

Medium

Long
Overall
Insider
Investor Psychology - Behavioural Finance - Quantitative Analysis - Scientific Methods
Technical Analysis - Insider Trades - Seasonal Variations - Intraday Trading
Stock data
| Price date | May 3, 2024 |
| Currency | NOK |
| ISIN | NO0010161896 |
| Rise from year low | 16.62% |
| Fall from year high | -4.72% |
Automatic technical analysis. Short term

Short term
DNB Bank has broken the falling trend channel in the short term and reacted strongly up. For the time being, it is difficult to say anything about the future trend direction. The stock is testing resistance at kroner 197. This could give a negative reaction, but an upward breakthrough of kroner 197 means a positive signal. The stock is assessed as technically slightly negative for the short term.Recommendation one to six weeks: Weak Negative (Score: -41)
Automatic technical analysis. Medium term

Medium term
DNB Bank is in a rising trend channel in the medium long term. Rising trends indicate that the company experiences positive development and that buy interest among investors is increasing. The stock is moving within a rectangle formation between support at 187 and resistance at 202. A decisive break through one of these levels indicates the new direction for the stock. The stock is between support at kroner 193 and resistance at kroner 202. A definitive break through of one of these levels predicts the new direction. The stock is overall assessed as technically slightly positive for the medium long term.Recommendation one to six months: Weak Positive (Score: 42)
Automatic technical analysis. Long term

Long term
DNB Bank is in a rising trend channel in the long term. Rising trends indicate that the company experiences positive development and that buy interest among investors is increasing. The stock has given a positive signal from the rectangle formation by a break up through the resistance at 182. Further rise to 221 or more is signaled. There is no resistance in the price chart and further rise is indicated. In case of a negative reaction, the stock has support at approximately 180 kroner. The stock is overall assessed as technically positive for the long term.Recommendation one to six quarters: Positive (Score: 94)
Full history

Candlesticks 95 days

Candlesticks 22 days

Insider Trades

Insider trades reported last 18 months. The stock is positive on Insider Trades.
| Date | Type | Count | Price | Value | Percent | Controlled | Text | Importance |
|---|---|---|---|---|---|---|---|---|
| Apr 23, 2024 | kjøp | 6000 | 205.71 | 1234 | 0 | 0 | Nestleder Jens Petter Olsen kjøper 6000 | 100 |
| Jan 31, 2024 | kjøp | 5000 | 205.00 | 1025 | 0 | 0 | Styremedlem Petter-Børre Furberg kjøper 5000 | 100 |
| Jul 13, 2023 | kjøp | 5000 | 196.25 | 981 | 0 | 0 | Styremedlem Petter-Børre Furberg kjøper 5000 | 100 |
| Apr 27, 2023 | kjøp | 6000 | 181.35 | 1088 | 0 | 0 | Nestleder Jens Petter Olsen kjøper 6000 | 100 |
Commentaries
Automatic technical analysis of the stock, based on last closing price. The chart may have changed since the analyst's recommendation was written.
Analyst's Recommendation
May 3, 2024 (1 days ago)Geir Linløkken
geir.linlokken@investtech.com
Recommendation one to six months: Positive
Geir Linløkken, May 3, 2024 (price 194.30)
DNB ligger i en stigende trendkanal på mellomlang sikt etter at investorene stadig har gått oppover i pris for å kjøpe seg opp i banken. Stigende trender faller ofte også sammen med en sterk økonomisk utvikling for bedriften eller forbedrede markedsutsikter.
Kursen tester nå gulvet i kanalen. Det øker risikoen for et brudd ned, men gar samtidig en større oppside. Taket i trendkanalen ligger på 229 kroner, og opp dit er det nå 18 prosent.
DNB er positiv på innsidehandler etter at styrets nestleder Jens Petter Olsen kjøpte seg opp for 1,2 millioner kroner den 23. april, samme dag som DNB presenterte sin førstekvartalsrapport.
Recommendation one to six months: Positive
Published: e24 (May 3, 2024 09:56) [GL]
The analysis is written by Investtech's analyst on the given date based on the price charts of this date. The analysis is meant to be valid for a few weeks, up to a few months. Later price developments may indicate changes in the market and investor optimism, and render the analysis outdated. Investtech's automatic analyses, updated daily, will often reflect such changes.
Previous recommendations
Geir Linløkken, Mar 1, 2024 (price 212.30)
DNB kommer på andreplass i Investtechs rangering.
Aksjen ligger i en stigende trendkanal på mellomlang sikt. På lang sikt er det gitt kjøpssignal fra en stor rektangelformasjon, og en videre oppgang til 239 kroner eller mer indikeres. Først må imidlertid den kortsiktige motstanden rundt 220 kroner brytes. Det kan imidlertid lett skje da det kortsiktige momentumet nå er sterkt positivt. Aksjen er dessuten positiv på innsidehandler etter kjøp fra styremedlem Petter-Børre Furberg for en måned siden.
Published: e24 (Mar 1, 2024 10:07) [GL]
Fredrik Dahl Bråten, Feb 25, 2024 (price 207.30)
Stigende trend. Blant selskapene som kan trekke børsen opp, er DNB. Banken er det nest største selskapet på Oslo Børs og har de siste årene sett god kursoppgang. DNB ligger i en stigende trendkanal på lang sikt og er opp 45 prosent de siste tre årene. Bryter aksjen opp gjennom motstanden ved 223 kroner, der kursen toppet ut i oktober, vil et nytt kjøpssignal utløses. Om aksjen heller reagerer tilbake, er det støtte ved 195 kroner som kan bremse et videre kursfall. Etter tre innsidekjøp det siste året fra nøkkelpersoner i styret, derav et for under en måned siden, er DNB positiv på innsidehandler.
Recommendation one to six months: PositivePublished: Morning Report (Feb 25, 2024 18:23), Today´s Case (Feb 25, 2024 18:23) [FDB]
Analysts' recommendations last 18 months

Positive/Weak Positive
Neutral
Negative/Weak Negative
History of Investtech's analysts' analyses of the stock. Analyses are shown by coloured dots on the day the analysis was based on.
| Evaluation | Time horizon | Price | Published | Analyst |
|---|---|---|---|---|
 Positive Positive | Medium term | 194.30 | May 3, 2024 09:56, e24 | GL |
| Positive | Medium term | 212.30 | Mar 1, 2024 10:07, e24 | GL |
| Positive | Medium term | 207.30 | Feb 25, 2024 18:23, Morning Report, Today´s Case | FDB |
| Positive | Medium term | 201.30 | Feb 9, 2024 07:55, e24, Morning Report | GL |
| Positive | Medium term | 205.20 | Feb 2, 2024 06:58, Morning Report, e24 | GL |
| Positive | Medium term | 214.60 | Jan 10, 2024 18:39, Morning Report, Today´s Case | FDB |
| Positive | Medium term | 206.10 | Nov 30, 2023 19:45, Today´s Case, Morning Report, e24 | GL |
| Positive | Long term | 200.40 | Oct 27, 2023 09:15, e24 | GL |
| Positive | Medium term | 200.40 | Oct 26, 2023 19:20, Morning Report, Today´s Case | GL |
 Neutral Neutral | Medium term | 207.60 | Oct 19, 2023 20:24, Morning Report | GL |
| Positive | Medium term | 210.40 | Oct 5, 2023 21:59, e24, Morning Report | FDB |
| Positive | Medium term | 218.00 | Sep 14, 2023 20:50, Today´s Case, Morning Report, e24 | GL |
| Positive | Medium term | 209.90 | Aug 23, 2023 08:43, Today´s Case, Morning Report, e24 | GL |
| Positive | Medium term | 208.70 | Aug 2, 2023 08:46, Morning Report, Today´s Case | GL |
| Positive | Short term | 198.20 | Jul 14, 2023 08:21, Trading Ideas | GL |
| Positive | Medium term | 202.30 | Jul 4, 2023 07:37, Morning Report | KP |
| Positive | Medium term | 197.50 | Jun 29, 2023 07:10, Morning Report | AT |
| Positive | Medium term | 190.55 | Jun 5, 2023 08:42, Morning Report, Today´s Case | AT |
 Weak Positive Weak Positive | Medium term | 193.40 | Dec 26, 2022 11:42, Morning Report | GL |
AT: Asbjørn Taugbøl (Analyst)
FDB: Fredrik Dahl Bråten (Analyst)
GL: Geir Linløkken (Head of Analyses)
KP: Kari Poblete (Analyst)
Results analysis
Average price development


Results publications in price chart

Results publications last 18 months
| Percentage change days before publication | Percentage change days after publication | |||||||||
|---|---|---|---|---|---|---|---|---|---|---|
| Publication date | Description | 22 d | 10 d | 5 d | 1 day | Publication | 1 day | 5 d | 10 d | 22 d |
| Average last 5 results publications | 1.59 | 1.60 | -0.90 | 0.22 | -2.67 | 0.25 | 0.03 | 0.20 | 3.54 | |
| Average last 20 results publications | 2.02 | 2.31 | 0.92 | 0.45 | 0.13 | -0.20 | -0.78 | -0.48 | 1.85 | |
Seasonal variations
Seasonal prediction from today's date

The blue line shows average price development the past 10 years, in the period from three months before to six months after today's date. The black line is actual price development in the past three months. Shaded areas are one and two standard deviations.
Monthly and annual statistics

Average development per month, last 10 years

Average development throughout the year, last 10 years
Annual development from 2014 to 2023

2014

2015

2016

2017

2018

2019

2020

2021

2022

2023
Trading limits

Average price development quarter by quarter past 66 trading days
Estimated price today
| Opening | 194.33 |
| High | 195.01 |
| Low | 193.76 |
| Close | 194.25 |
| Opening to high | 0.35% |
| Opening to low | -0.29% |
| Opening to close | -0.04% |


Early warning
| Close prices next day that when broken will generate new signals |  | |
|---|---|---|
| Indicator | Price | Objective |
| High-RSI | 217.65 | - |
| Short Term Trading Range | 202.41 | - |
| Rectangle | 202.40 | 222.85 |
| Last close | 196.65 | - |
| Long Term Trading Range | 191.59 | - |
| Low-RSI | 176.67 | - |
| Moving average | 91.62 | - |
| Indicator: | Type of indicator generating the signal | |
| Price: | If close price next day has crossed this value, a technical signal is created | |
| Objective: | Price target for the positive or negative signal (Only listed for patterns) | |
Alerts
| Date | Price | Trading opportunity | Time span | Target |
|---|---|---|---|---|
| May 3, 2024 | 196.65 | Reaction back after formation buy | Long term | 217.00 - 232.00 |
Key ratios
Dividend yield: 8.3%

P/E: 7.6

P/S: 3.7

P/B: 1.1

Dividend per share: 16.08

Earnings per share: 25.42

Revenue per share: 52.87

Book value per share: 183.20

Market cap million NOK: 299 730.
De siste nøkkeltallene er beregnet ut fra delårsrapportene siste 12 måneder og sluttkurs 194.30 fra May 2, 2024.
Financial data
| MNOK | 2015 | 2016 | 2017 | 2018 | 2019 | 2020 | 2021 | 2022 | 2023 | Q1-24 |
|---|---|---|---|---|---|---|---|---|---|---|
| Revenues | 53 993 | 52 163 | 51 140 | 50 368 | 54 857 | 56 399 | 55 915 | 66 115 | 81 697 | 81 559 |
| Profit for the year | 24 762 | 19 251 | 21 803 | 24 282 | 25 721 | 19 840 | 25 355 | 32 861 | 39 479 | 39 210 |
| Profit margin | 45.9 % | 36.9 % | 42.6 % | 48.2 % | 46.9 % | 35.2 % | 45.3 % | 49.7 % | 48.3 % | 48.1 % |
| Book value | 190 078 | 206 423 | 216 897 | 223 966 | 242 255 | 248 396 | 243 912 | 259 098 | 269 296 | 282 605 |
| Equity ratio | 7.3 % | 7.8 % | 8.0 % | 8.5 % | 8.7 % | 8.5 % | 8.4 % | 8.0 % | 7.8 % | 7.3 % |
| Revenue per share | 33.14 | 32.02 | 31.47 | 31.00 | 34.19 | 36.13 | 36.07 | 42.64 | 52.70 | 52.87 |
| Book value per share | 116.68 | 126.72 | 133.48 | 137.83 | 151.00 | 159.12 | 157.33 | 167.12 | 173.70 | 183.20 |
| Earnings per share | 16.05 | 12.48 | 14.13 | 15.74 | 16.67 | 12.86 | 16.44 | 21.30 | 25.59 | 25.42 |
| Dividend per share | 4.75 | 6.02 | 7.48 | 8.69 | 9.36 | 8.50 | 9.80 | 12.56 | 16.08 | 16.08 |
| Dividend payout | 31 % | 51 % | 56 % | 58 % | 58 % | 67 % | 60 % | 59 % | 63 % | 63 % |
Dividend yield

Dividend yield is the company's share dividend in relation to the share price. It is a measure of return to shareholders. Dividend yield is calculated as Dividend per share/Share price.
Dividend yield for DNB is 8.3%.
Dividend yield for DNB is 8.3%.
P/E - price/earnings

P/E stands for Price/Earnings, that is, share price in relation to the earnings per share. The key figures are used when assessing a share price in relation to the company's profit. Example: A P/E number of 10 means that the share costs 10 times the company's annual profit. P/E is calculated as Share price/Earnings after tax per share.
P/E for DNB is 7.6.
P/E for DNB is 7.6.
P/S - price/sales

P/S stands for Price/Sales, that is price relative to sales. The key figures are used when evaluating a share price in relation to the company's sales. Example: A P/S number of 2.0 means that the stock costs 2.0 times the company's annual turnover. P/S is calculated as Share price/Revenue per share.
P/S for DNB is 3.7.
P/S for DNB is 3.7.
P/B - price/book

P/B stands for Price/BookValue, that is price relative to equity. The key figures are used when evaluating a share price in relation to book equity. Example: A P/B figure of 1.8 means that the share costs 1.8 times the company's equity. P/B is calculated as Share price/Equity per share
P/B for DNB is 1.1.
P/B for DNB is 1.1.
Help and information - Research shows the importance of Trend, Momentum and Volume
Investtechs analyses focus on a stocks trend status, short term momentum and volume development. These are central topics of technical analysis theory that describe changes in investor optimism or fluctuations in a companys financial development. However, Investtechs strong focus on these elements is due to research results that clearly indicate causation between these factors and future return on the stock market.
Trend

Theory: Stocks in rising trends will continue to rise.
Psychology/economy: Rising trends indicate that the company experiences positive development and increasing buy interest among investors. Read more
Research: Stocks in rising trend channels in Investtechs medium long term charts have been followed by an annualized excess return of 7.8 percentage points compared to average benchmark development. This is shown by Investtechs research into 34,880 cases of stocks in rising trends on the Nordic Stock Exchanges in the period 1996 to 2015.
Read more about the research results here
Momentum

Theory: Stocks with rising short term momentum will continue to rise. Stocks with very strong momentum (overbought) will react backwards.
Psychology/economy: RSI above 70 shows strong positive momentum. The stock has risen in the short term without any significant reactions downwards. Investors have kept paying more to buy stocks. This indicates that more investors want to buy the stock and that the price will continue to rise. Read more
Research: Stocks with strong momentum have on average continued to rise, and more so than the average stock listed on the Exchange. This is shown by Investtechs research into 24,208 cases of stocks on the Nordic Stock Exchanges in the period 1996 to 2015 where RSI went above 70 points, indicating strong and increasing short term momentum. On average, annualized, the stocks rose the equivalent of 11.4 percentage points more than the average stock.
Read the research report here
Volume

Theory: Rising prices on high volume and falling prices on low volume indicate strength in a stock. Volume can confirm a rising trend or signal that a falling trend is ending.
Psychology/economy: When investors very much want to buy a stock, they have to increase the price to find new sellers. Rising price on high volume shows that some investors are so aggressive that they push the price up to be able to buy the stock. Investtechs Volume Balance tool measures the relation between price rise and volume and measures investor aggression at rising and falling prices. Read more
Research: Stocks with volume balance above 40 have been followed by an average annual return of 4.7 percentage points on the Nordic Stock Exchanges, shown by research conducted by Investtech into 24,580 cases.
Read the research report here
Investtech's analyses
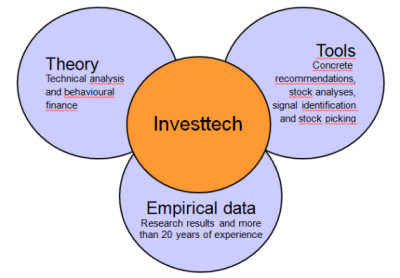
Investtech has combined theory, psychology and research into powerful investment tools.
About Investtech
Investtech are behavioural finance and quantitative stock analysis specialists. The company sells analysis products to private, professional and institutional investors. Investtech manage the AIFM company Investtech Invest, which invests customers funds in the stock market.
Investtechs computers analyze more than 28,000 stocks from 12 different countries every day. The analyses are presented in eight languages and sold to customers worldwide. In addition to the automatic analyses, the companys analysts present subjective assessments and recommendations for some markets. The analyses are available to customers in the form of daily morning reports and cases, and weekly market updates and model portfolios.
Investtechs algorithms for analysis, ranking and stock recommendations are based on research dating back to 1993. Part of the research was conducted in cooperation with Oslo University and the Norwegian Research Council. Research still has high priority for Investtech. Many of the companys research results are available for customers on the companys web site.
The companys basic product starts at approx. 30 euro per month. Investtech also provides bespoke products for integration on partners web sites and for use in newsletters, for example to stock brokers and the media. Contact us by e-mail to info@investtech.com or by phone +47 21 555 888 for more information. A free trial subscription is available to order on our web site www.investtech.com.

Head Office
Investtech ASStrandveien 17
1366 Lysaker
+47 21 555 888
Postal address
Investtech ASStrandveien 17
1366 Lysaker
info@investtech.com
VAT no. 978 655 424 MVA
Research Department
Instituttveien 102007 Kjeller
www.investtech.com
Investor Psychology - Behavioural Finance - Quantitative Analysis - Scientific Methods
Technical Analysis - Insider Trades - Seasonal Variations - Intraday Trading
Funds managed by Investtech own shares in the company. This does not influence the analysis which is automatically generated. Read more >>
Investtech is co-operating with DNB. This does not influence the analysis which is automatically generated. Read more >>
Investtech guarantees neither the entirety nor accuracy of the analyses. Any consequent exposure related to the advice / signals which emerge in the analyses is completely and entirely at the investors own expense and risk. Investtech is not responsible for any loss, either directly or indirectly, which arises as a result of the use of Investtechs analyses. Details of any arising conflicts of interest will always appear in the investment recommendations. Further information about Investtechs analyses can be found here disclaimer.
The content provided by Investtech.com is NOT SEC or FSA regulated and is therefore not intended for US or UK consumers.
Head office
Strandveien 171366 Lysaker, Norway
Research department
Instituttveien 102007 Kjeller, Norway
×